|
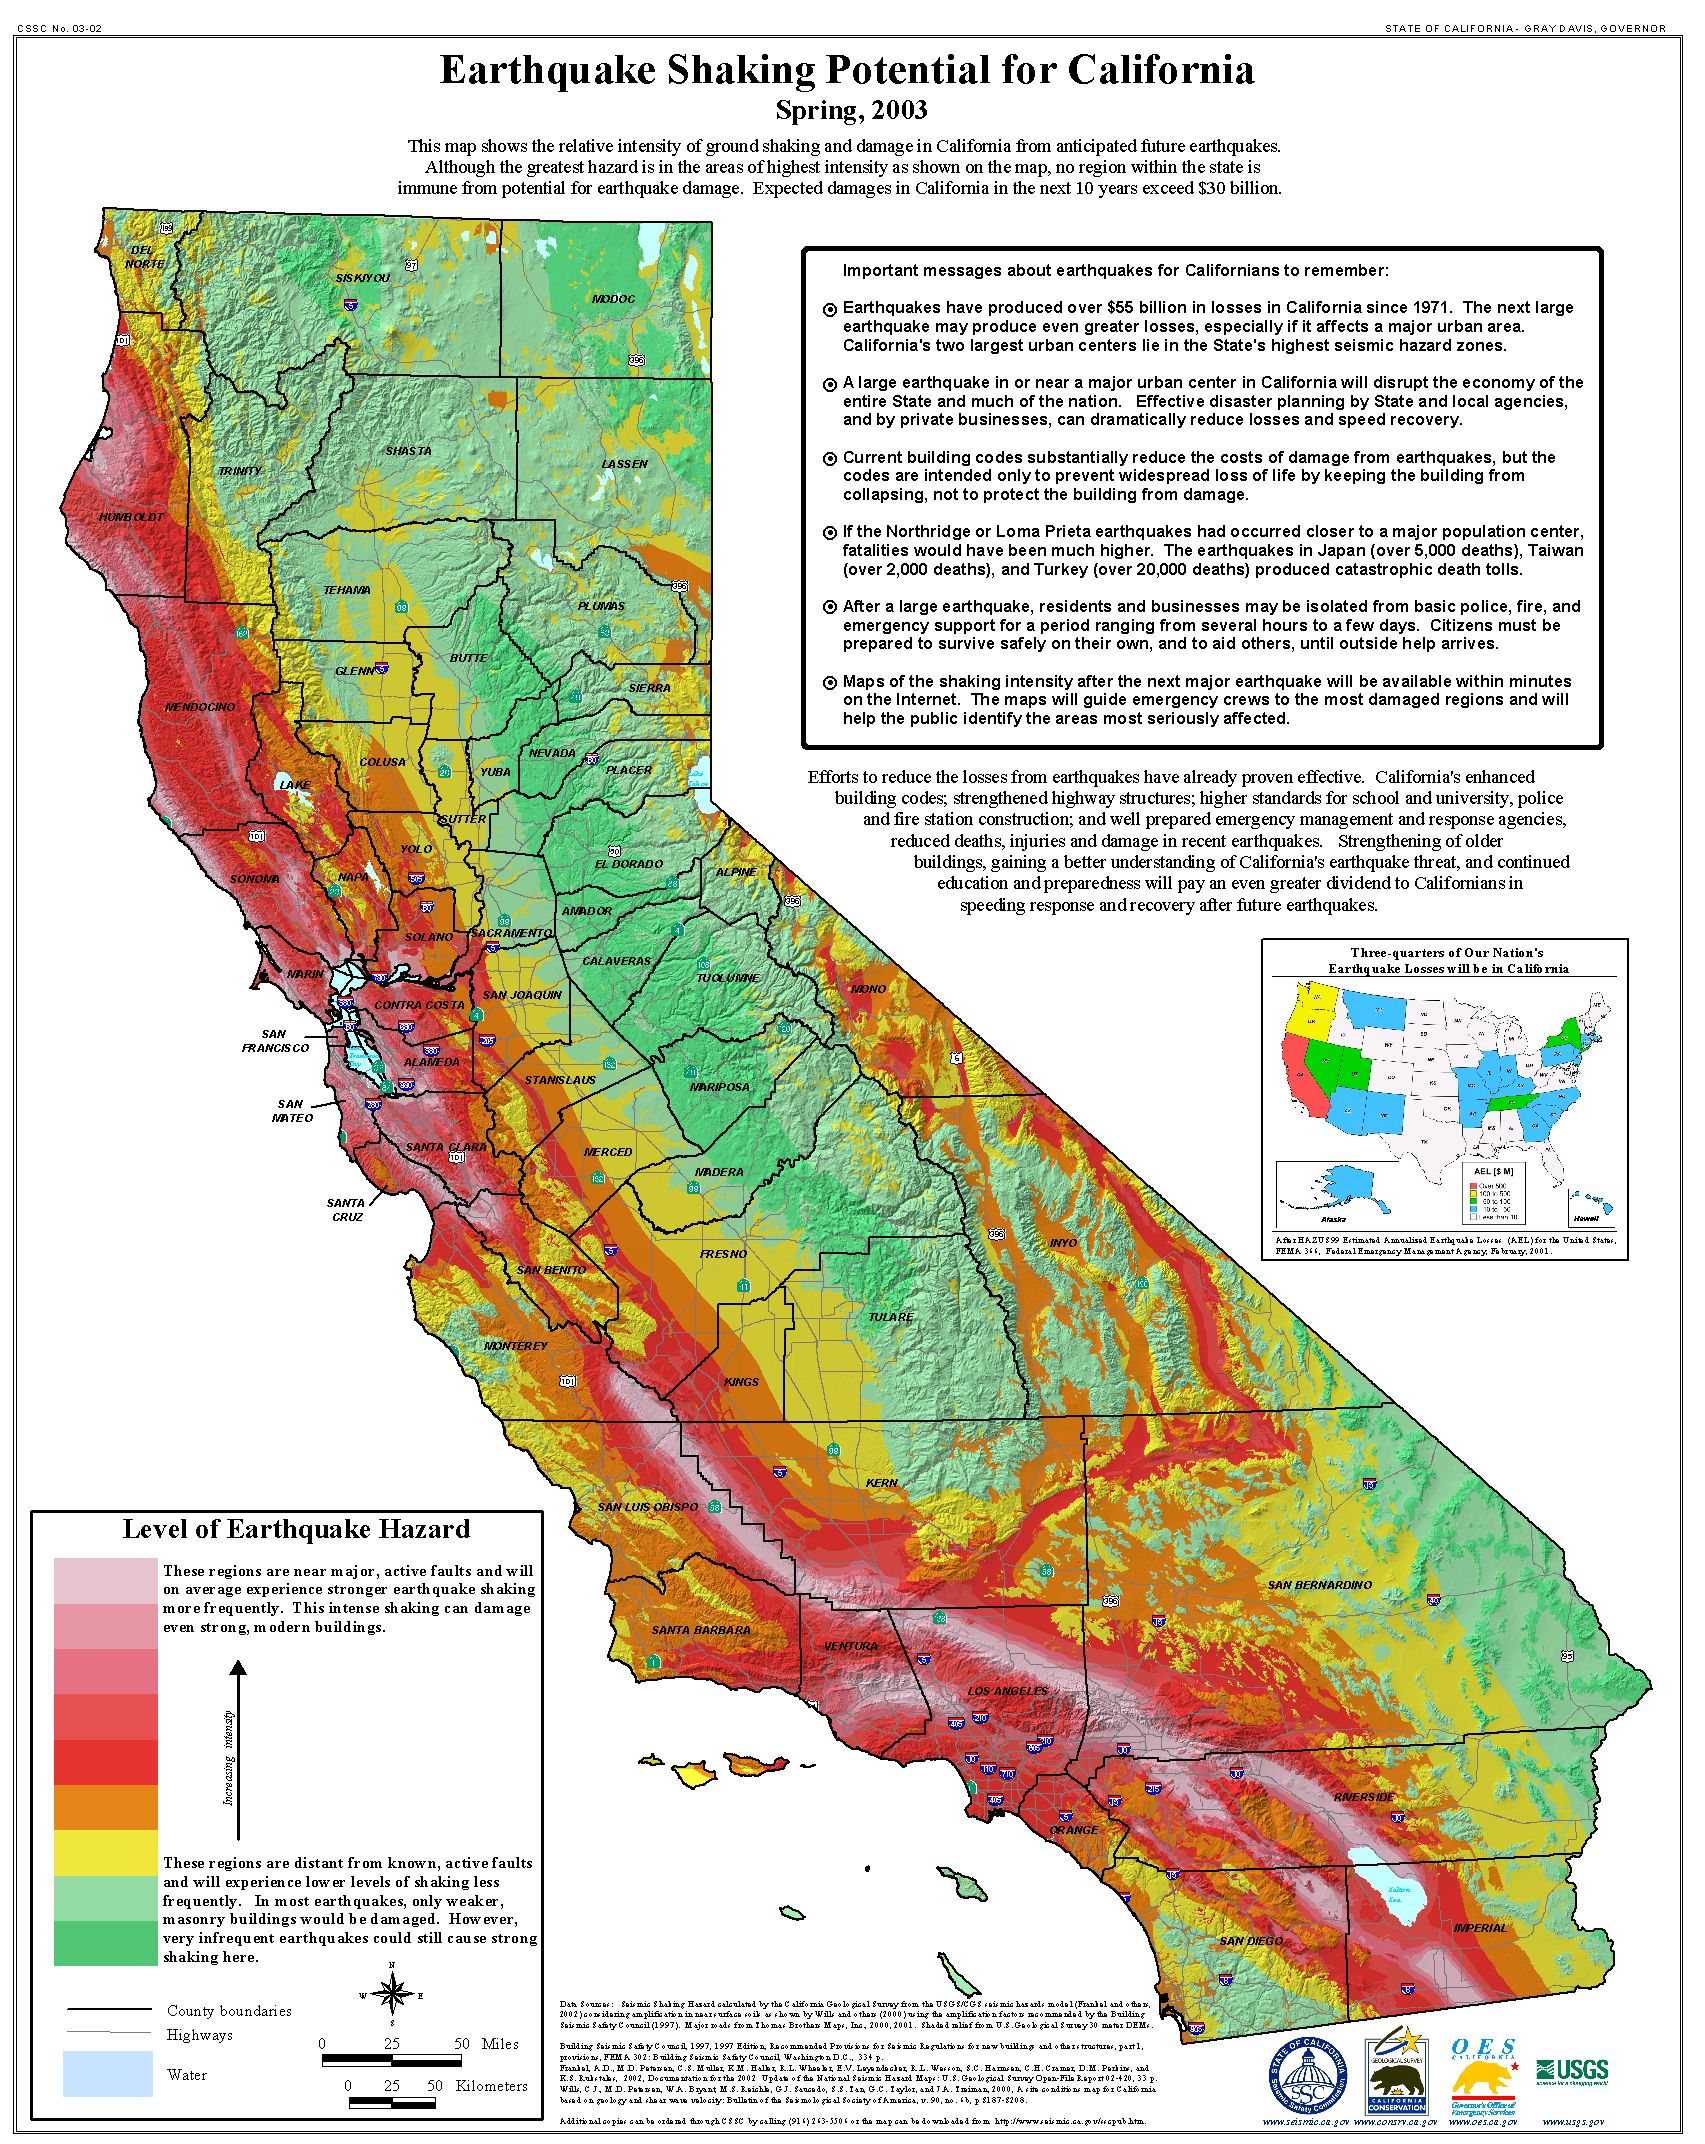
The maps are typically expressed in terms of probability of exceeding a certain ground motion. For example, the 10% probability of exceedance in 50 years maps depict an annual probability of 1 in 475 of being exceeded each year. This level of ground shaking has been used for designing buildings in high seismic areas. The maps for 10% probability of exceedance in 50 years show ground motions that we do not think will be exceeded in the next 50 years. In fact, there is a 90% chance that these ground motions will NOT be exceeded. This probability level allows engineers to design buildings for larger ground motions than what we think will occur during a 50-year interval, which will make buildings safer than if they were only designed for the ground motions that we expect to occur in the next 50 years. View/Download a copy of Earthquake Shaking Potential map shown at right: For a regional map showing shaking for eastern California and western Nevada. Click here for Map. (pdf file) Information provided by: conservation.ca.gov |
Probabilistic Seismic Hazard Map

Contact Info
Phone: 510 763-6933
Fax: 510 763-6941
License #438236-B
Bonded, Licensed, and Insured
Testimonials
I loved working with Frankee, David and Domingo and I really appreciated the time that Jerome took to explain things, before they even began Phase 1.
Ellen C., Alameda CA
Follow Us!